My friend Ryan and I recently assembled a steel puzzle box styled to look like a Minecraft block of gold ore and protected by several layers of deception and protection. In this post I’ll describe the design and assembly process, as well as how we destroyed several Arduinos along the way.
If you don’t want to know how to solve this puzzle, STOP and don’t read this blog post.
Fig 1: The Puzzle Safe
Design
Our goal was to make a working (i.e. legitimately secure) safe that had an unexpected form of “password.” As the construction of the safe was to be sturdy, it was critical that we included backup mechanisms, especially early in the design process, to avoid locking ourselves out. We decided to use the physical orientation of the safe as the primary “password entry” mechanism, with a light sensor as a backup.
The largest square sections of scrap steel I could find at Coremark were about 10” on a side. I picked up several options at various thicknesses ranging from about ⅛” to 1/16”. I opted to use two thicker plates for the top and the bottom so that most welds would include a thick piece (and thus have a lower chance of accidentally cutting through the metal).
Fig 4: Design Notes for the External Chassis
I considered adding triangular braces to increase shear strength, but instead opted to get some thick L-shaped pieces. I assembled the frame using my Hobart MIG welder and (if I recall correctly) 0.30 feed steel wire.
I opted to weld the hinge into place, rather than attempting to find a way to bolt it on, as the latter would have required externally-visible screws or very thick sides.
Painting (Destroyed Arduinos: 0)
I applied a layer of gray primer and left it under a heat lamp for many hours to attempt to counteract the cold weather. Then I used templates to add gold and yellow paint to attempt to match the appearance of a gold ore block.
Fig 5: Gray Primer Applied
Fig 6: Painting Gold Ore with Stencils
Finally, I added a layer of spray-on urethane to seal the paint and resist scratches.
Electrical Design (Destroyed Arduinos: 1)
The Arduino Redboard can work on 5-12 volts. The solenoid lock can operate on approximately 9-12 volts. I first tried actuating the solenoid lock from a GPIO pin on the Arduino, but it did not have enough power. I attempted to use a single 9v battery to power both the Arduino and the solenoid lock. However, I forgot that when a solenoid changes state it can induce a large voltage spike. This happened, killing one of the Arduinos.
Fig 7: Destruction of an Arduino via Induced Voltage
In my revised electrical design I opted to both split the power supplies entirely and add a flyback diode to help bleed off voltage spikes from the solenoid.
Fig 8: Revised Electrical Design
Electrical Enclosure (Destroyed Arduinos: 0)
Fig 9: Enclosure Design
I opted for slotted friction fittings rather than using mounting holes because it makes it easier to fit lots of boards in a small space.
One tricky element was making sure the light sensor was exposed such that a bright light through a hole in the exterior chassis would actually be able to reach it. It took several test prints to get the size right for each board with enough friction to hold it firm but not so much that it would risk breaking either the board or the chassis.
I created several internal mounting slots for the Arduino, relay, and a prototyping board. Then I added two external slots for the accelerometer and light sensor.
Fig 10: Electrical Enclosure Mounted
We also learned that the physical size of the RedBoard has changed over the last few years. In particular, the soldering holes have been removed from recent versions of the board, changing its width.
Software (Destroyed Arduinos: 1)
We started writing the software assuming that we would need to write a discrete integral to detect rotations of the safe using the gyroscope (recall, the accelerometer was actually a combined accelerometer/gyroscope).
However, as sometimes happens on all projects, during testing of the rotation software one of our Arduinos just stopped connecting to any computers. This is an important lesson: sometimes things just fail.
However, as Ryan and I looked at the logging output from his phone’s gyroscope and accelerometer, we realized we could get a 80% solution using just the accelerometer!
An accelerometer at rest will always report a vector with magnitude 1g directly down due to gravity. This means that at any time the safe is at rest, the magnitude of its acceleration vector will be 1. If we mounted the accelerometer at a 90 or 180 angle to the sides of the cube, exactly 1 of the vectors reported by the accelerometer (X,Y,Z) will have an absolute value of 1 since the safe is a cube! You can find all of the software on github here.
Fig 11: Acceleration Measurement Description
This realization dramatically simplified our software needs. It meant we could not detect some movements (spinning the safe without changing which of its faces is down), but that still gave us enough flexibility to implement a compelling puzzle.
Testing (Destroyed Arduinos: 1)
Fig 12: Testing the Light-based Backup Software (Photo by August Schwerdfeger)
We included two mechanisms for opening the safe in the software. The primary system, discussed at length, was via measurement of box position via accelerometer. However, we did not start there.
The first thing we installed and tested was the emergency bypass cable that would allow opening the lock manually with a 9v battery in the event of a software failure.
Next, we tested the light-based opening system. This was intended to be a secondary “key” to be used in the event of a sensor failure in the accelerometer. This took some work to tune to the right amount of light to be usable, without tripping accidentally and ruining the fun.
Finally, we tested the accelerometer based system. During this testing Ryan accidentally rotated the cube with a USB cable still attached to the Arduino, tearing off its USB port and making the code, as Ryan put it, “extremely frozen.”
Fig 13: That's not supposed to come off
Deployment (Destroyed Arduinos: 0)
We gave our friend the safe, along with some other puzzles, just a few hours after making the final software changes and completing final testing. It worked as desired! He reported, “Got it open without using any explosives or angle grinders.”
This was one of the most fun projects I’ve worked on because it included multiple engineering disciplines, puzzles, a time crunch, and the joy of giving away a unique invention. We gave our friend the safe and after several days of anxious waiting received the wonderful news:
“Got it open without using any explosives or angle grinders”
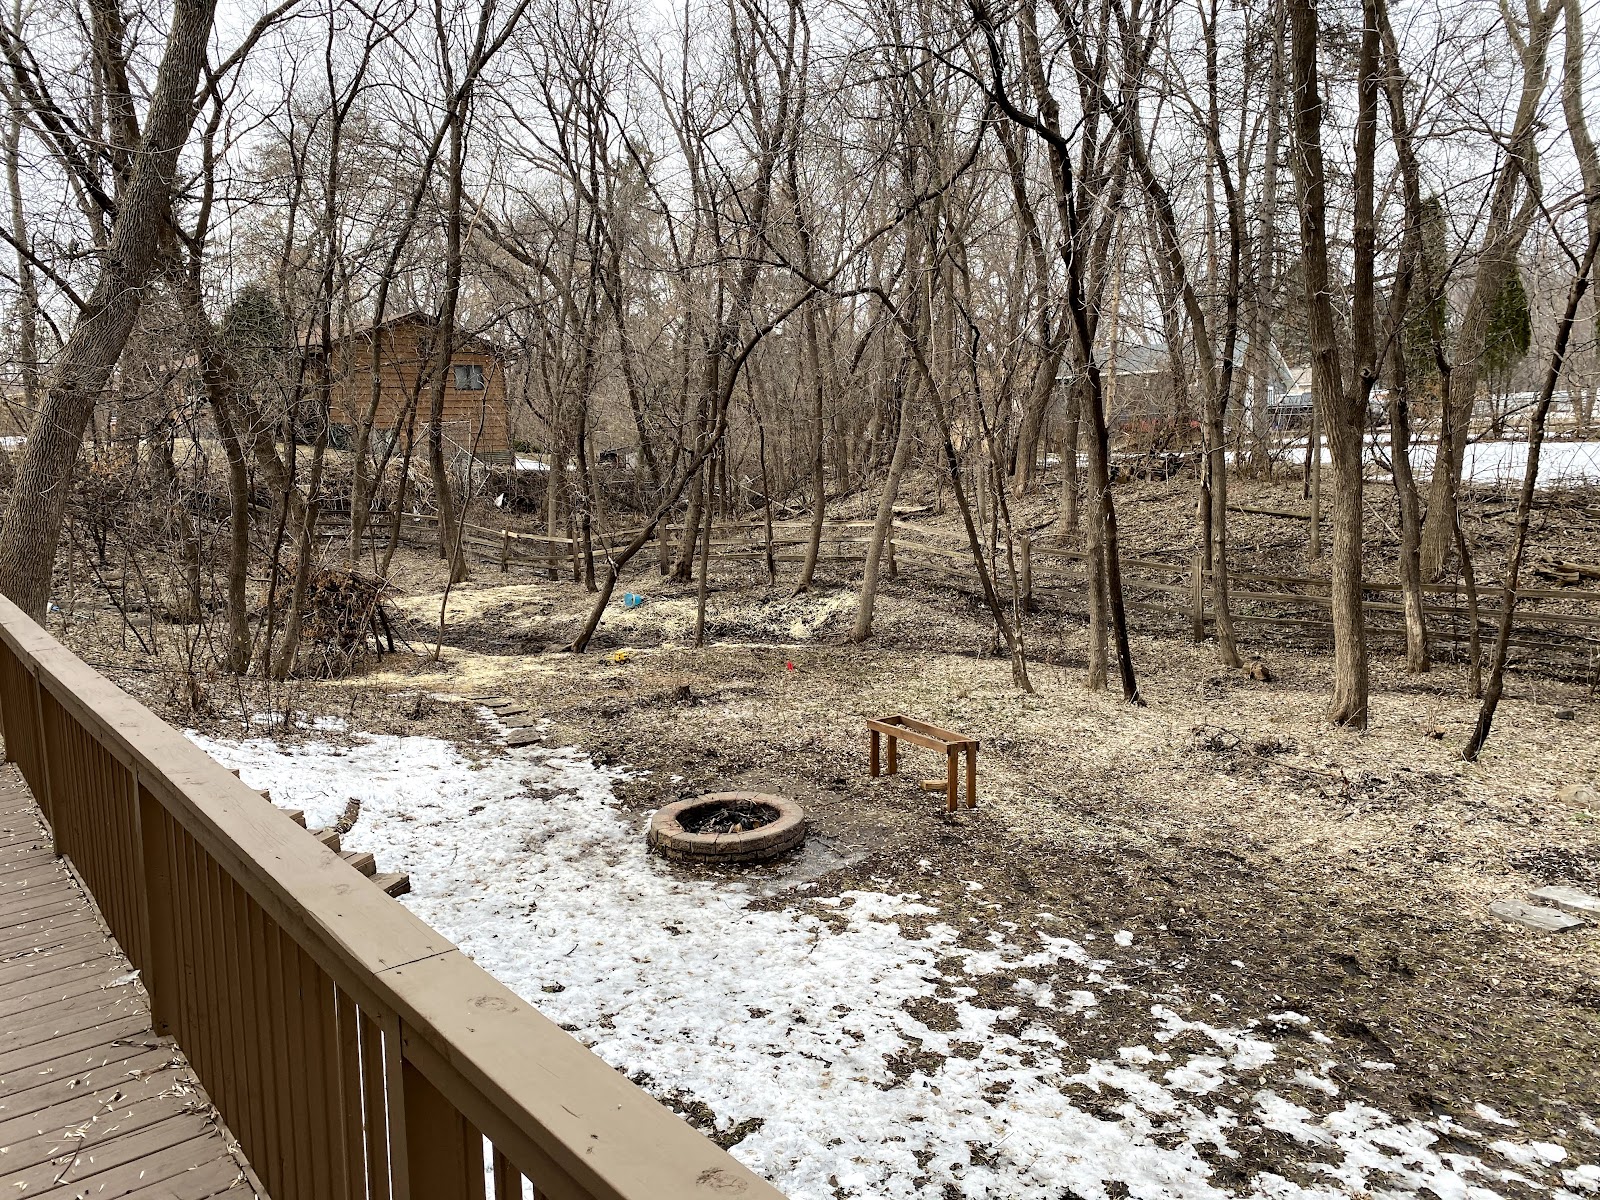
In 2019 we moved to a new home and had to leave our old fort behind. There was nothing to do but start again! We got more ambitious this time around.
We picked a location far enough from the main house to feel adventurous, but close enough that we could easily see the fort from the house and house from the fort.
Fort Location
I did the initial design in SketchUp. With some help from my dad, I decided to use four 6"x6" posts as the main supports (upgrading from the 4"x4"s used in the previous fort).
Fort Scale
Since we live in Minnesota, we had to dig down 4' for each of the four posts to avoid heaving risk in winter.
Posts Poured
With help from the neighbors we set up the posts and braced them into position.
I don't own a construction helmet, so I used a bike helmet
We notched out the posts to mount two 2"x8" ledger boards.
We lag bolted the ledger boards to the posts, then hung 2"x6" joists between them. We used ledger strips, rather than joist hangers, to save money (the size difference between the ledger board and joists allow this approach).
We put down plywood decking and decorated it.
We installed a temporary roof to keep rain from spoiling the plywood decking.
Adding a temporary roof. Also shown, rails to keep people from falling out
We used the fort as-is for quite a while, since it made a great place to see the yard and the kids enjoyed playing in it.
The gully flowing, as seen from the fort
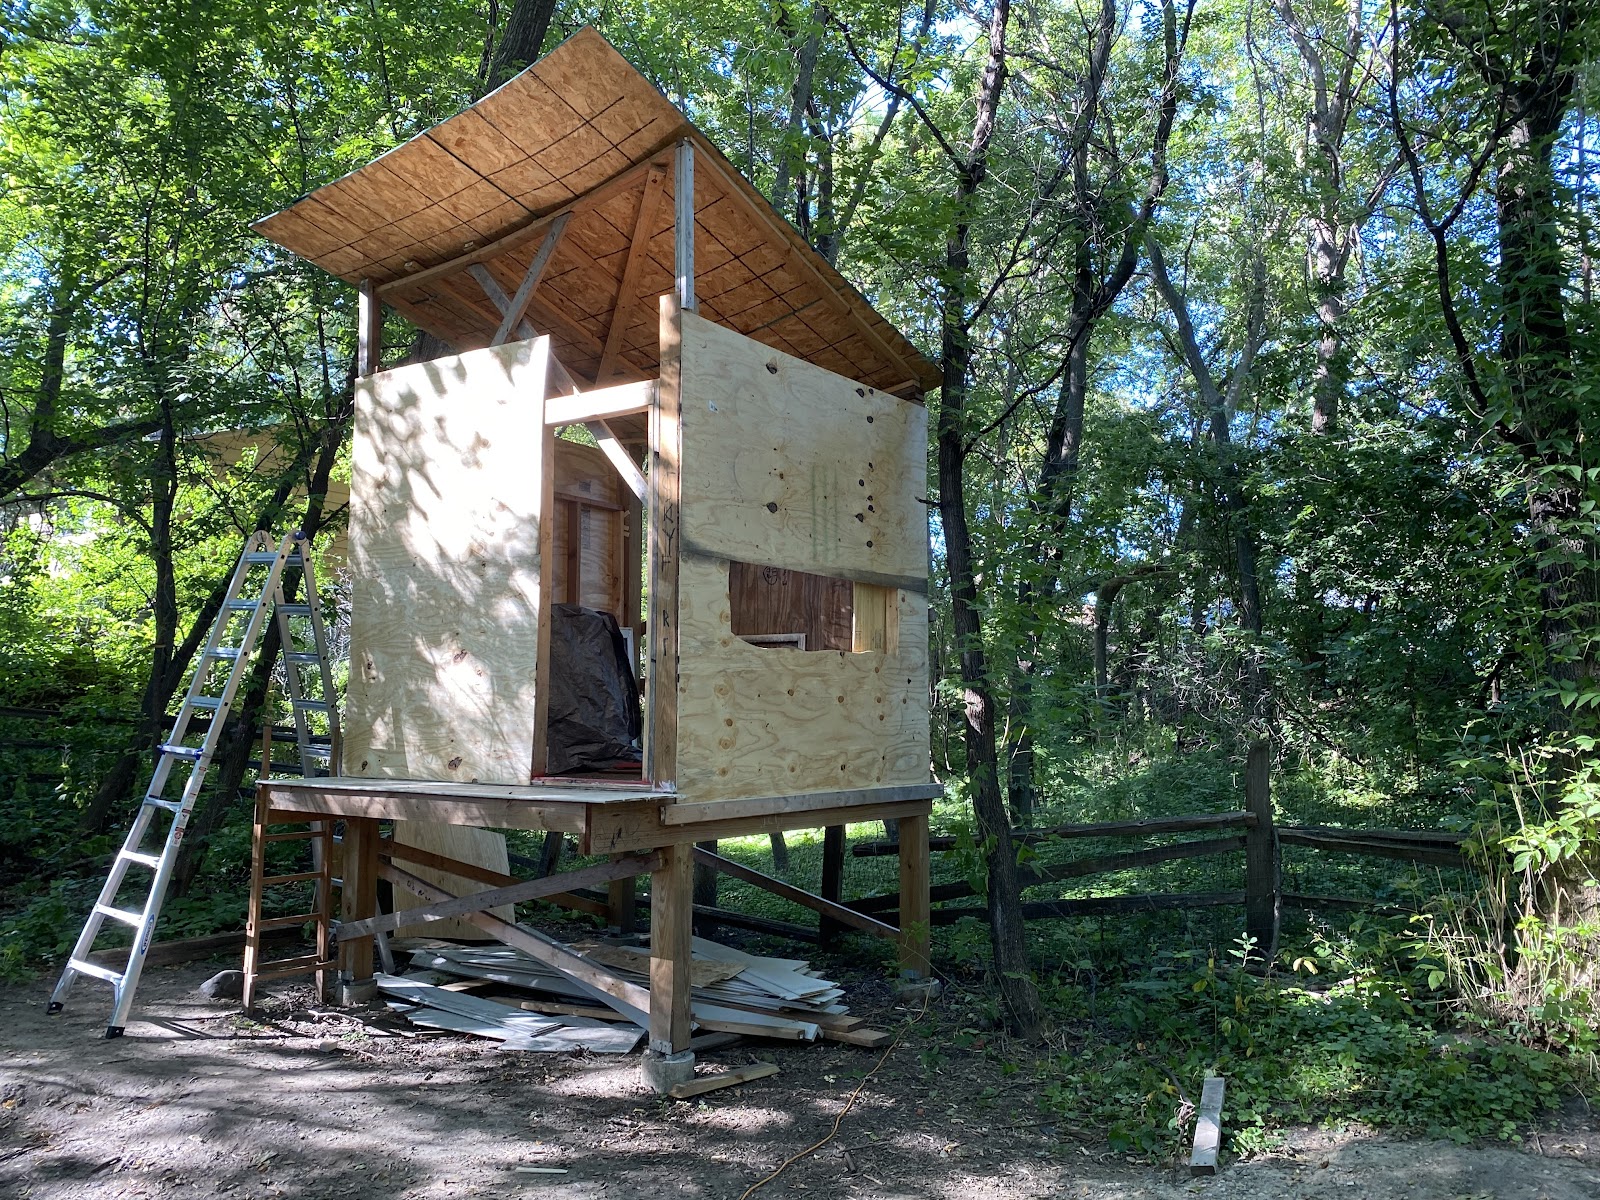
Eventually (a couple of years later!) we decided it was finally time to add some walls. My dad and I stick-built the walls from 2"x4"s and the kids helped with sheathing.
Nailing on sheathing
Fort with sheathing and a hole cut for a window
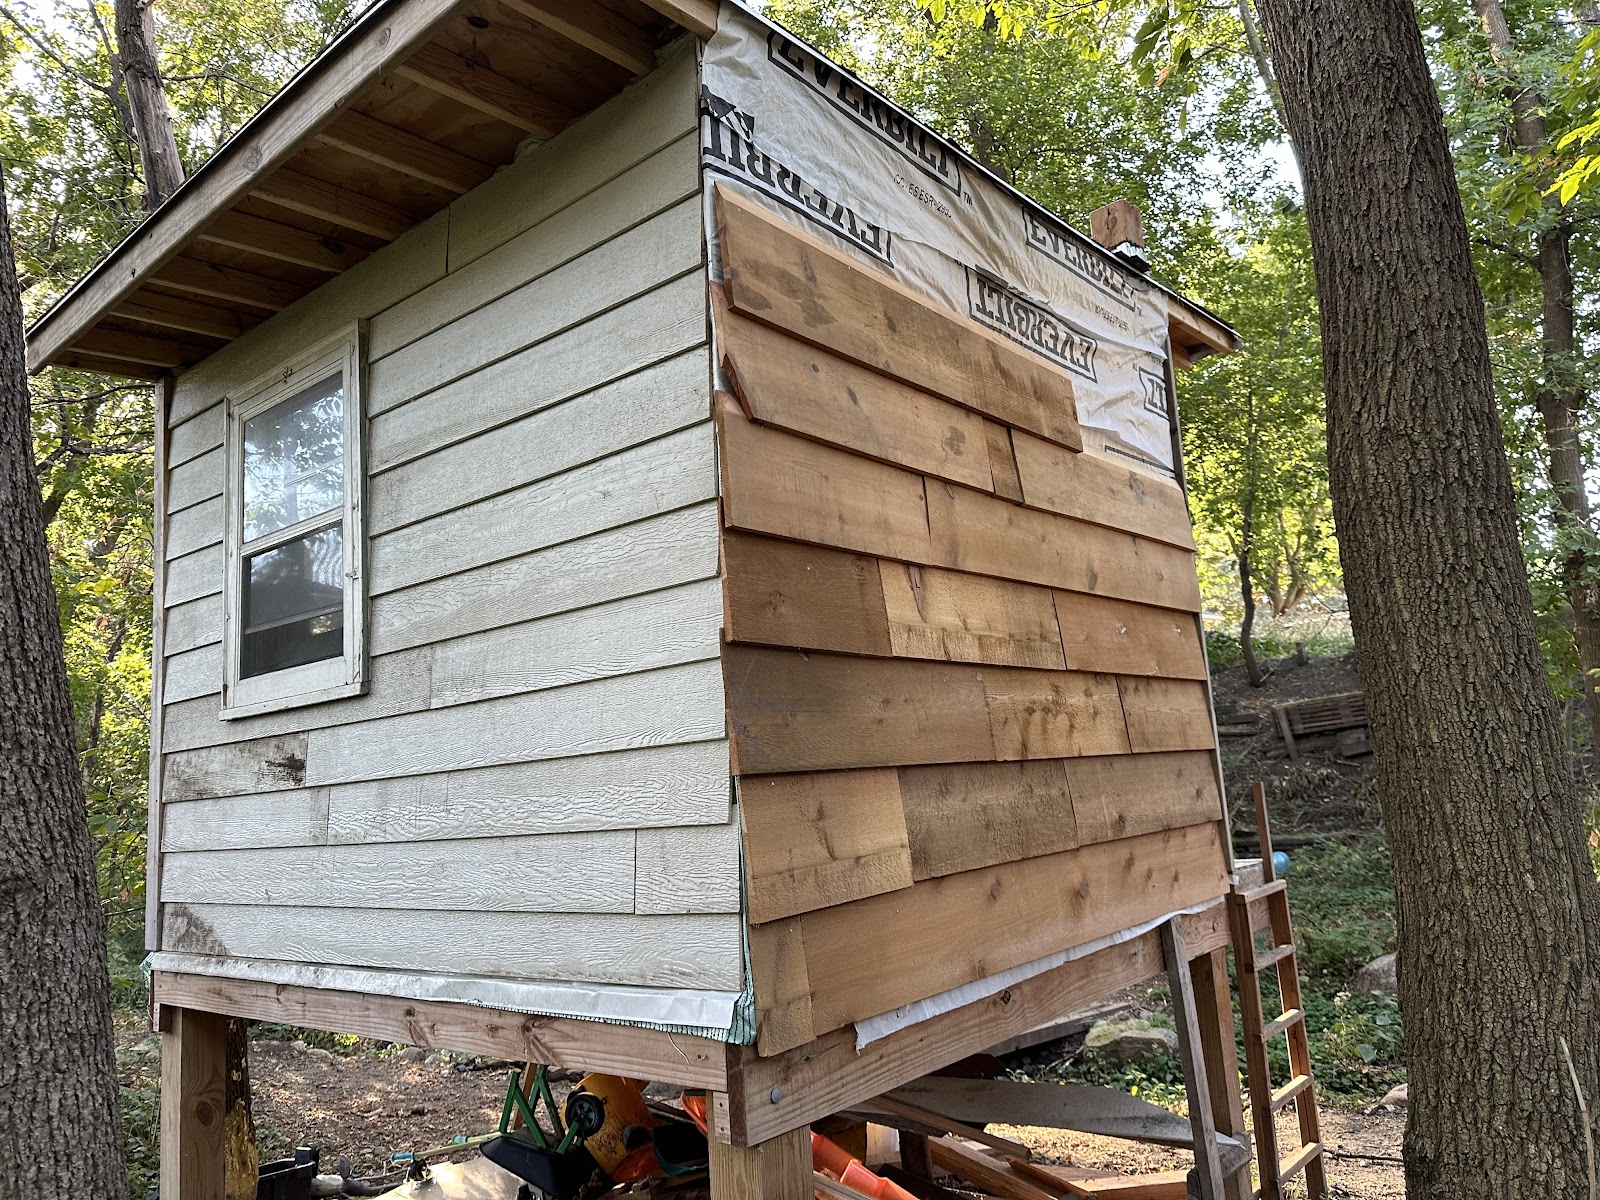
We used house wrap left over from siding our main home, and some friends gave us a couple of old windows.
My dad did the trim and siding on the front.
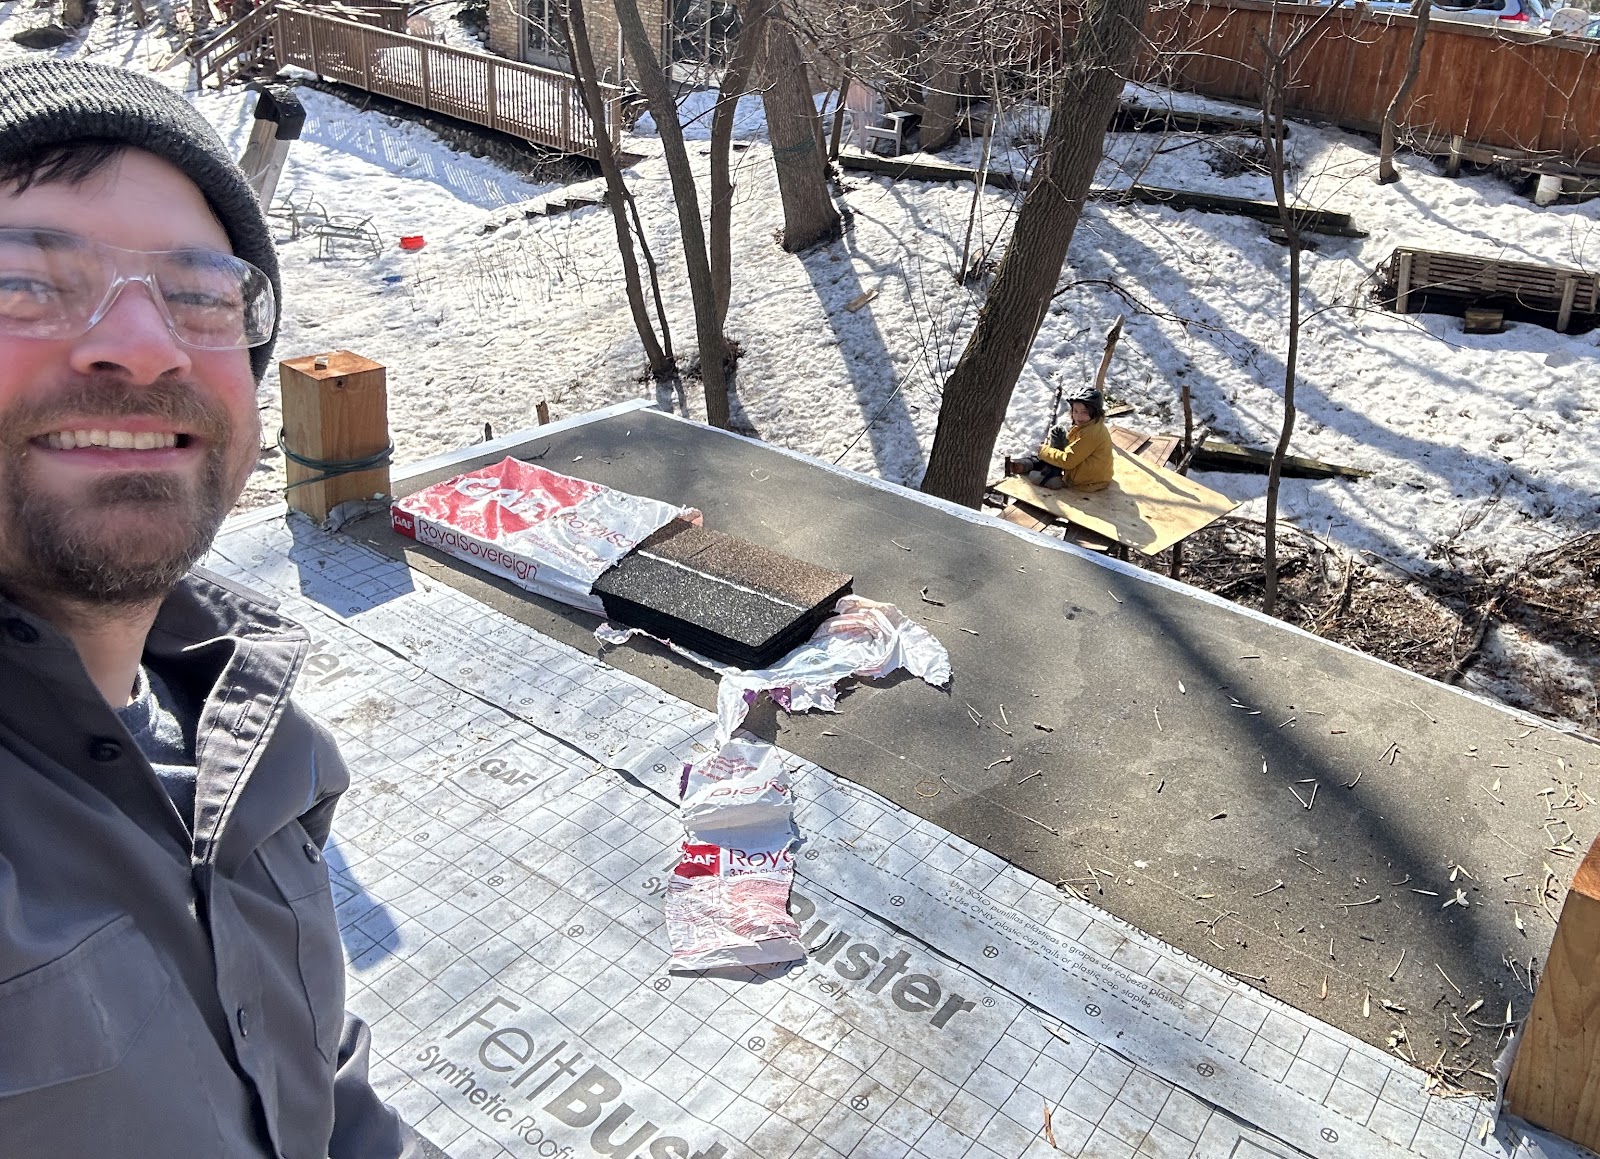
It was time to replace the temporary (now years old) roof with a real roof. We still plan to add a rooftop patio, so the real roof had to be a little shorter than the top of the 6"x6" posts.
I managed to finish shingling the new roof just before winter in 2022.
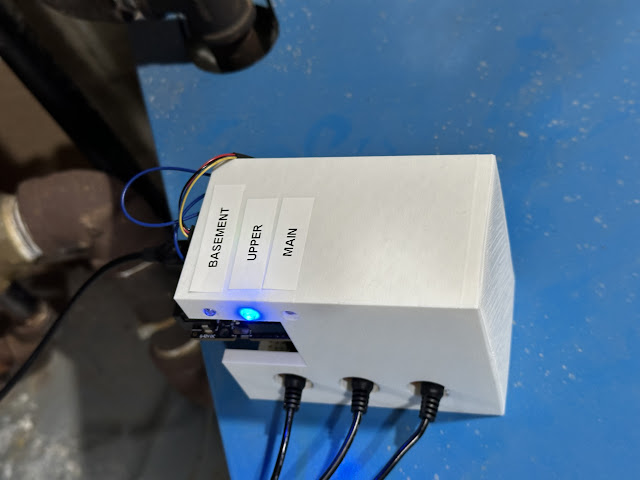
I was having trouble keeping track of which of my house's three heating zones was activating the boiler and pump at any given time. So I built a device to monitor which zone was calling for heat.
Zone activation sensor system, with indicator lights
I used Prometheus to keep track of zone activation over time.
Two days of zone activation lots via Prometheus. The temperature dropped over the last 8 hours, so you can see the upper floor is constantly active.
Build Process
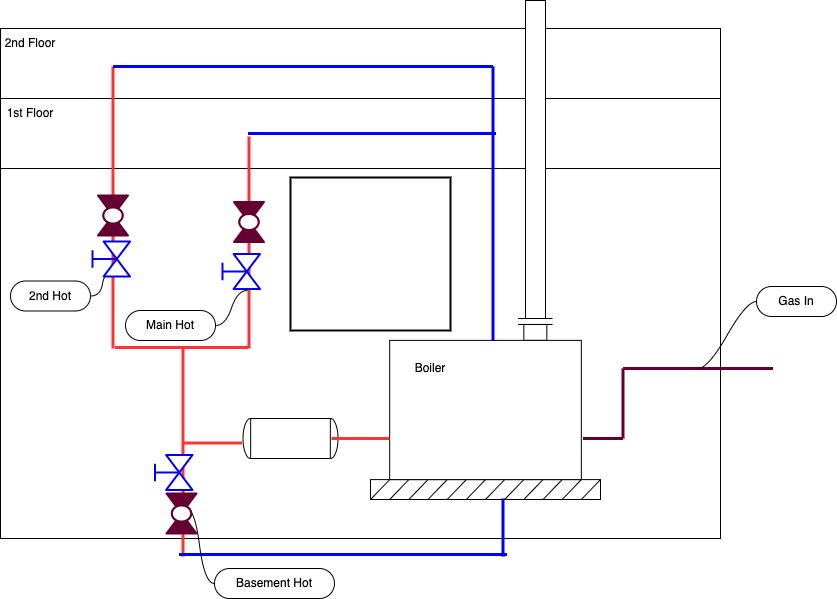
My house has a hot-water heating system with three zones, each controlled by a valve like this one.
Zone controller, photo via Amazon.com
There are three zones, each managed with one of these zone valves. Each zone valve is controlled by a thermostat.
Boiler and control valves
These control values take a 24 Volt Alternating Current (VAC) input. When a thermostat calls for heat, it does so by sending 24 VAC to its control valve. The control valve opens the physical valve and sends 24 VAC to the boiler.
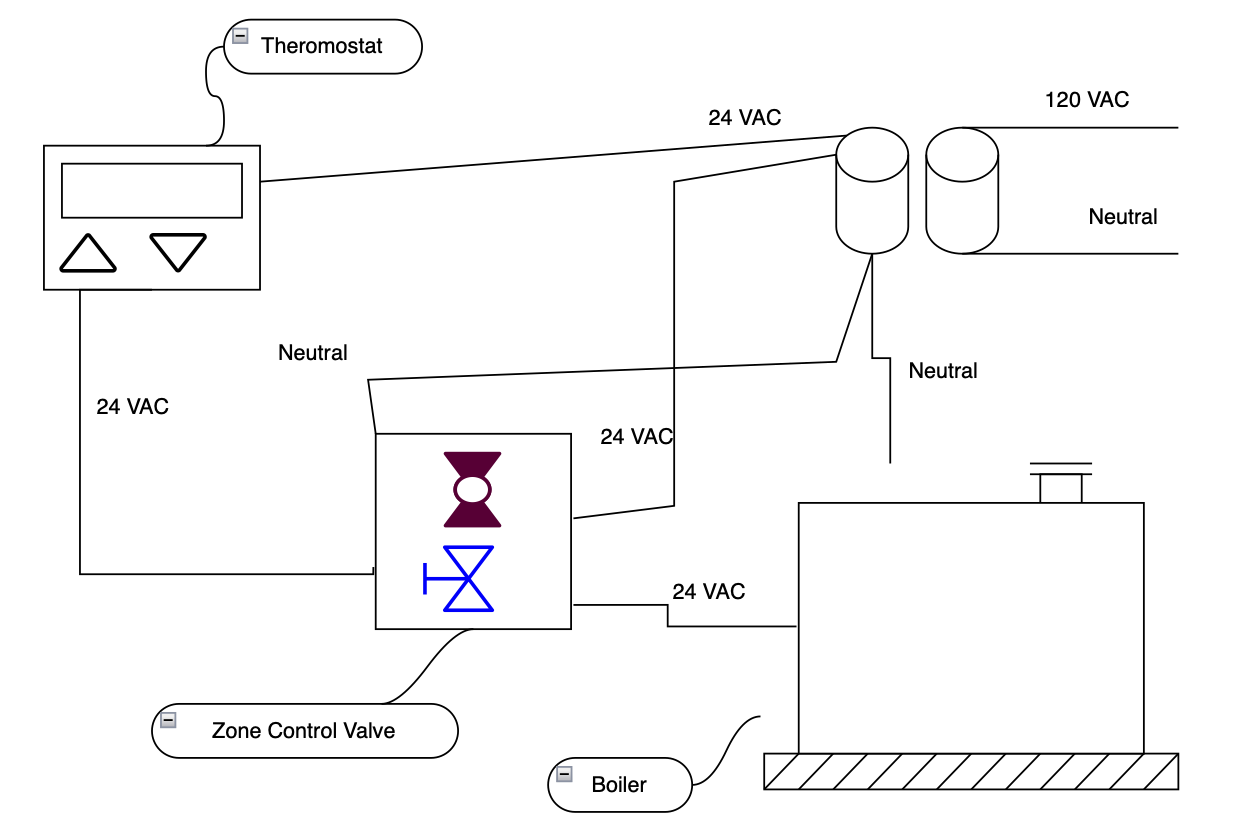
Diagram of power flow through the boiler system. The thermostat is effectively a switch that, when activated, closes the connection between the 24VAC transformer and the zone control valve.
The boiler system uses a transformer to convert the standard 120 VAC wall power to the 24 VAC used for the heating system.
Each thermostat has its own settings for when to call for heat. The basic function of a thermostat is to track a set point (e.g., 68 degrees) and a current temperature (e..g, 70 degrees). If the current temperature is below the set point (in the case of a heating thermostat, e.g., 65 degrees) the thermostat will close the circuit from the transformer to the control valve. The control valve will open the pipe for hot water to the associated region of the house and will also close a circuit to provide 24 VAC to the boiler. This, in turn, causes the boiler to heat up and the water pump to turn on.
Side note: newer thermostats like a Google Nest Thermostat require a "C-Wire." The C-Wire or "Common-Wire" is a neutral wire that allows the thermostat to use the 24 VAC supplied by the transformer. Without a C-Wire, the thermostat is just like a switch.
Approach
I wanted to monitor which thermostat was calling for heat at what time and for how long. I also did not want to modify the heating system (I definitely don't want to break out boiler in the dead of winter!) To do this, I took advantage of a handy property of alternating current: you can indirectly measure it. Alternating current creates a magnetic field, which you can measure without directly touching the wires carrying that current.
I purchased some of these clamp sensors (you can find them on eBay), which can measure alternating current on a wire when clamped around it.
Clamp current sensor photo via eBay
I connected these to an Adafruit Metro ESP-32 S2, and used its analog ports to measure the voltage reported by each clamp sensor.
I wrote a CircuitPython program to read the analog signals from the clamp sensors, then make that reading available to my prometheus server via a simple HTTP endpoint. Setting up CircuitPython took a bit of work, let me know in a comment if you would like a blog post about that process.
The endpoint looks like this when viewed with a web browser:
Statistics reported by the thermostat monitor system
I configured my Prometheus server to scrape the thermostat statistics every 15 seconds. To generate a graph of when thermostats are active, I can use a query like:
A query and associated results viewed in the Prometheus graph viewer
In this case we can see that the upper floor heat was active almost continuously over the past ten hours. This is not surprising, since an arctic vortex just arrived.
Conclusion
CircuitPython is really handy for making Internet of Things (IoT) devices that work with an aggregator like Prometheus.
Earlier this year we bought an Alesis Turbo Mesh electric drum kit. The kit works well, but my drum teacher advised me to switch from the spring/trigger kick pedal to a proper kick drum pedal. I ordered a kick pedal and sensor from eBay, but was bummed to discover that the Turbo Mesh kit only works with a "switch" style kick pedal.
Fig 1: The Goal (Images via Alesis.com)
The Alesis Turbo Mesh kick pedal connects using a standard 1/4" mono jack. When the pedal is depressed, the two conductors in the mono jack are connected and the control module recognizes it as a "kick." You can easily demonstrate this by touching both parts of the kick drum 1/4" connector with a wire.
The higher quality kick sensors are analog, meaning instead of a binary on/off (like a switch) they change the voltage on a signal wire, which is interpreted by a microcontroller. This is how electric drum kits get different volume levels for different intensity strikes. In this case, I needed to convert the analog signal from the kick pedal to a binary on/off before the signal reached the Alesis drum controller.
Fig 2: Connections (Images via Alesis.com and Sparkfun.com)
I bought an Arduino Redboard from Sparkfun for about $20. The Redboard has analog and digital I/O pins, making it an easy choice for this project. I also had some relays left over from the Fort Lock project. I bought a couple of 1/4" jacks.
After updating the preferences, I was able to select the Redboard and connect!
Reading Analog Values
I connected the kick drum sensor to an analog pin on the Redboard and used the example serial reader code to read the voltage levels from the kick sensor.
Fig 3: Serial reader sample code from Sparkfun
Using the built-in LED I was able to reliably detect "kicks" using the analog sensor and looking for sudden increases in voltage. The Arduino software does not provide time guarantees, but the main loop ran fast enough that any latencies were not noticeable.
Writing Digital Values
To trigger the "kick" I needed to "connect" the two conductors from the Alesis control unit's kick cable. There were a couple of options available to accomplish this. Using a multimeter, I found that the Voltage difference between the two kick sensor conductors was 3 Volts.
To make the signal consistent, I had to create a common ground connection between the drum control unit and my Redboard. I connected a solid wire from the Redboard to part of the breakout connector on the bottom of the drum control unit.
Fig 4: Connection point to establish common ground
I tried sending 3V directly using the Redboard's digital output pins, but the latency was too high (it sounded like about 300-500 milliseconds). My suspicion is that the Redboard could not supply the voltage quickly enough the internal resistance in the drum control unit.
To overcome this issue, I used a relay that acted like a switch to close the connection between the two signal lines in the kick drum cable. I can't find the exact product I used (it was from eBay) but it was similar to this (Amazon). I understand from talking with friends that an OpAmp could have achieved the same thing, but I have not learned how to use those yet.
I designed a simple case in FreeCAD and printed it.